Last Week $854M Inflow, Yesterday $145M Outflow: What Is the BTC ETF Capital Signal Actually Telling Us?
Last Week $854M Inflow, Yesterday $145M Outflow: What Is the BTC ETF Capital Signal Actually Telling Us?
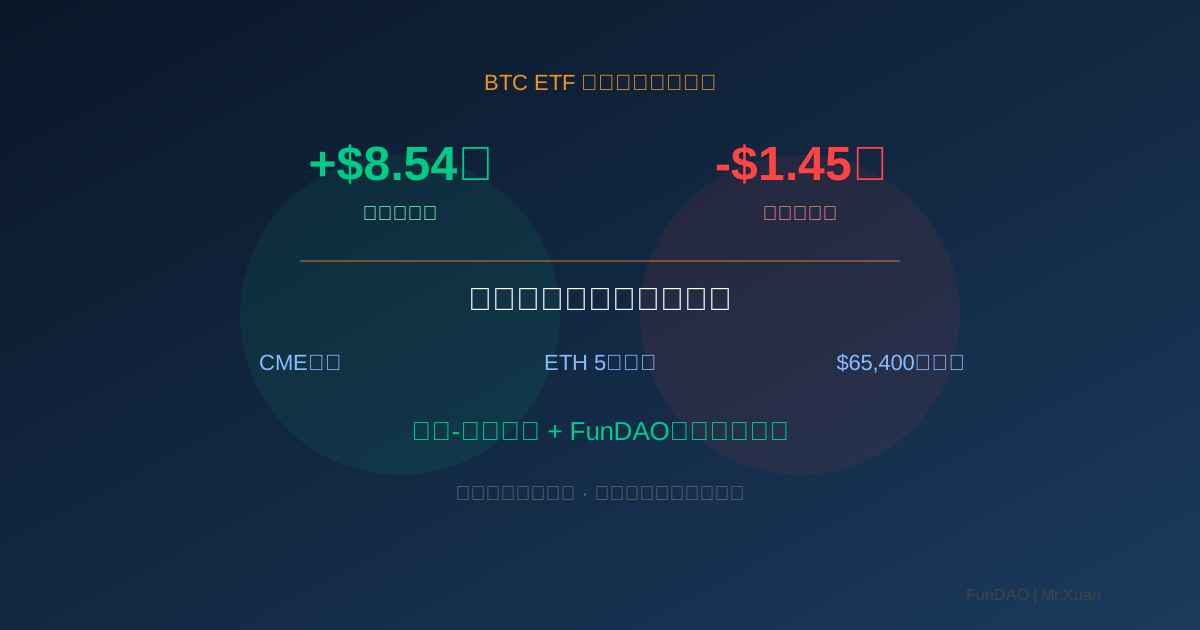
On August 11, a data point made many BTC holders nervous: Bitcoin spot ETFs saw a net outflow of $145 million yesterday, with BlackRock's IBIT alone accounting for $53.56 million of that outflow.
Just days earlier, the same batch of ETFs had recorded their best weekly performance since April — a single-week net inflow of $854 million.
Buying aggressively one week, pulling out the next. What are institutions actually doing? Is this a short-term correction or a trend reversal? Should retail follow or flee?
Don't panic yet. I pulled the ETF capital flow data for the past month. Let's look at the full picture.
First, the Full Data Picture — Don't Be Spooked by One Day
BTC spot ETF capital flows over the past 30 days look roughly like this:
Mid-July: Two consecutive weeks of net outflows, totaling approximately -$300M. Market sentiment was terrible then, with BTC briefly dipping below $58,000.
Late July – Early August: The wind shifted dramatically. Single-week net inflow of $854M. ETH ETFs also posted 5 consecutive weeks of inflows. CME (Chicago Mercantile Exchange) hedge funds flipped from net short to net long.
August 11: Single-day net outflow of $145M.
See the pattern? This isn't a trend reversal — it's normal volatility.
Institutional capital isn't a faucet — on means constant flow, off means nothing. It's a tide, with ebbs and flows. What matters is the tide's direction, not any single day's wave.
BlackRock's $53.56M Outflow — What Does It Mean?
Many people get nervous seeing 'BlackRock outflow.' After all, IBIT is the largest BTC spot ETF, managing over $30 billion in BTC.
But $53.56M relative to a $30B total is less than 0.2%. This looks more like a rebalancing operation than 'BlackRock is bearish on BTC.'
What's rebalancing? Simply put: IBIT's holdings need to maintain a fixed ratio relative to BTC price. When BTC rises, the fund's BTC value increases, so it needs to sell some to maintain the ratio. This isn't bearish — it's mechanical.
And look at the broader data: while IBIT saw $53.56M in outflows, other ETFs (like Fidelity's FBTC and Grayscale's GBTC) had offsetting flows. The total net outflow of $145M is really nothing against daily trading volumes.
What Signals Actually Matter?
Rather than any single day's net flow, three indicators deserve more attention:
1. CME Futures Positioning
CME (Chicago Mercantile Exchange) Bitcoin futures data is the barometer of institutional sentiment. Recently, CME hedge funds flipped from net short to net long — meaning professional traders are betting on BTC going up.
Futures money is leveraged. Going long means they're confident in the direction. This signal is far more reliable than short-term ETF flows.
2. ETH ETF's 5 Consecutive Weeks of Inflows
Many people overlooked this. BTC ETF flows might go in today and out tomorrow, but ETH ETFs have posted 5 straight weeks of net inflows. This suggests institutional allocation is shifting from 'BTC only' to 'BTC + ETH dual allocation.'
The retail takeaway: if you're still only holding BTC, you might be missing the second track institutions are building.
3. BTC's Repeated Tests of $65,400
BTC has twice tested $65,400 without breaking through. This level is critical — a breakout opens new upside, failure to break could mean a pullback to $60,000.
But note: chip concentration has risen to 14.8%. This means large amounts of BTC are concentrated in few addresses, and market volatility risk is accumulating. Once a key level breaks (up or down), the move will be violent.
How Should Retail Respond?
I know this is what you care about most. Direct conclusions:
Strategy 1: Core-Satellite Allocation
Put the majority of your capital (say 70%) in BTC and ETH as your 'core holdings.' Don't trade this frequently — follow the institutional long-term trend. The sustained ETF net inflows are the big picture — short-term volatility doesn't change the long-term direction.
The remaining 30% is your 'satellite allocation' — some higher-yield DeFi projects. But note: not Meme coin gambling. Choose projects with clear mechanisms.
Strategy 2: DCA > Market Timing
Don't try to guess tops and bottoms. Even BlackRock's traders can't time the market perfectly — what makes you think you can?
DCA (Dollar Cost Averaging) works because: when prices rise, you profit; when they fall, you buy cheaper chips. Long-term, DCA outperforms 80% of 'smart' traders.
Strategy 3: Deflationary Tokens as Yield Enhancement
This is FunDAO's positioning. BTC and ETH are your base layer, tracking the broader market. FunDAO-type deflationary tokens provide additional yield enhancement — automatically burning 2.5% daily, independent of market direction, independent of institutional capital flows.
Institutional money can flow in today and out tomorrow, but FunDAO's burn mechanism executes every single day. Whether ETFs see net inflows or outflows, your ownership percentage keeps increasing.
An Honest Word
ETF capital flow data matters, but it's just one piece of the puzzle. If you make decisions based on daily net flow numbers, short-term volatility will drive you insane.
Institutional behavior logic is completely different from retail. They rebalance, reposition, hedge — operations that look like 'bearish signals' to retail are actually just normal asset management.
As a retail investor, your biggest advantage isn't information (you'll always be slower than institutions), isn't speed (you'll always be slower), but patience. Institutions have quarterly performance pressure; you don't. Institutions need to explain every decision to LPs; you don't.
Use that advantage. Don't be spooked by one day's capital flow data. Look at the big picture, make your allocations, and go about your day.
By Mr.Xuan | FunDAO Research